
Understanding the Difference Between Dimensions and Metrics
In the world of data analysis and measurement, two fundamental concepts play a pivotal role in unraveling the complexities of information: dimensions and metrics. These two terms serve as the building blocks of data interpretation, providing the framework upon which analytical insights are constructed. Dimensions refer to the qualitative attributes that add context and granularity to our data, offering a lens through which we can view information from different angles. Metrics, on the other hand, encompass the quantitative values that allow us to quantify, compare, and evaluate various aspects of our data. Distinguishing between dimensions and metrics is not just a matter of semantics; it forms the bedrock of accurate and insightful analysis. This crucial differentiation empowers analysts to navigate the intricate landscape of data with precision, enabling them to uncover patterns, trends, and correlations that might otherwise remain obscured. As we delve deeper into the realm of dimensions and metrics, we will unveil their distinctive roles and shed light on how mastering this dichotomy can unlock the true potential of data-driven decision-making.
What are Dimensions?
In the realm of data analysis, dimensions represent the qualitative attributes that lend depth and context to our dataset. Think of them as the descriptive characteristics that help us organize and understand information from various perspectives. Dimensions provide the necessary background information that transforms raw data into meaningful insights. They act as categorical labels, allowing us to segment and group data points based on specific criteria. For instance, in an e-commerce dataset, dimensions could include time intervals, geographic locations, or product categories, each adding a distinct layer of information to the analysis.
How do dimensions provide context to data?
Dimensions act as contextual markers that enrich the significance of data points. By incorporating dimensions, we can analyze data in a more holistic manner, accounting for variations that might otherwise go unnoticed. Consider a sales analysis: comparing revenue figures without considering the dimension of time might lead to incomplete conclusions. However, when time is introduced as a dimension, we can identify trends, seasonal patterns, and growth trajectories. Dimensions provide the backdrop against which metrics can be evaluated, enabling us to draw more accurate and insightful conclusions.
Examples of dimensions:
- Time: Analyzing sales data over quarters, months, or specific dates.
- Location: Studying customer demographics by country, city, or region.
- Product Category: Segmenting sales figures based on different product types.
- Customer Segmentation: Grouping customers by age, gender, or buying behavior.
- Audience: Age groups, interests, and gender define the diverse audience engaging with your campaign
- Creative: Ad formats, design variations, and messaging tones tailor your message for different viewer preferences.
- Device Type: Desktop, mobile, and tablet categories reveal where your campaign resonates most effectively.
- Market:Geographic location, language preferences, and cultural context help you connect with specific regions.
What are Metrics?
Metrics, in the context of data analysis, are the quantitative measurements that allow us to assess, compare, and quantify aspects of our data. They are the numerical values that provide concrete information about the performance, behavior, or characteristics of a particular dimension. Metrics take the raw data and transform it into actionable insights by applying calculations and evaluations. In essence, metrics translate the abstract into the tangible, allowing us to make data-driven decisions.
How do metrics quantify and measure data?
Metrics provide a standardized way to measure and evaluate data, often involving mathematical formulas or statistical analyses. They transform dimensions into meaningful, comparable values that can be interpreted and used for decision-making. For instance, in an online marketing campaign, metrics like conversion rate, click-through rate, and return on investment (ROI) provide quantifiable measures of campaign effectiveness, enabling marketers to optimize their strategies.
Examples of metrics:
- Impressions:Impressions quantify your reach, revealing how many times your content was displayed.
- Clicks: Clicks measure the audience’s interest, showing how many engaged with your content
- Click-Through Rate (CTR): The ratio of users who click on an ad to the number of total users who viewed it.
- Views:Views showcase engagement, indicating how many users interacted with your visuals.
- Revenue: The total income generated from sales.
- Conversion Rate: The percentage of users who take a desired action, such as making a purchase or signing up.
- Customer Churn Rate: The rate at which customers stop using a product or service over a specific period.
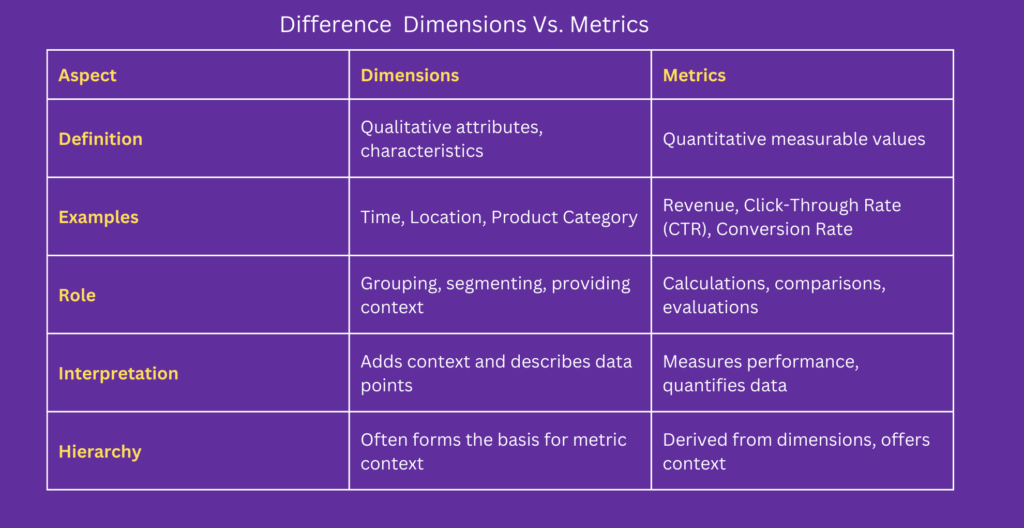
Differences Between Dimensions and Metrics
Nature of Data: Unveiling the Qualitative-Quantitative Distinction
At the heart of data analysis lies a fundamental dichotomy between two essential components: dimensions and metrics. These components embody the essence of qualitative and quantitative data, respectively. Dimensions serve as the custodians of qualitative richness, encapsulating the characteristics and attributes that define our data points. They provide the canvas upon which our analytical portrait is painted, enabling us to discern patterns, relationships, and contextual nuances. Metrics, in contrast, are the numeric workhorses that transform this qualitative canvas into a realm of quantifiable value. They bestow upon us the power to measure, calculate, and assess, giving structure to our insights and allowing for direct comparisons. Dimensions describe the intricate details, while metrics quantify their significance—ultimately crafting a comprehensive narrative within the data landscape.
Role in Analysis: Orchestrating Grouping and Calculation
The interplay between dimensions and metrics orchestrates a symphony of analysis. Dimensions take center stage when it comes to organizing, grouping, and segmenting data. Imagine a vast dataset of customer transactions: dimensions like geographic location, product category, or purchase date allow us to segment the data, revealing insights specific to particular subsets. Metrics, on the other hand, emerge as the maestros of calculation and comparison. They wield their arithmetic prowess to perform calculations like sums, averages, and ratios, turning raw data into actionable insights. Metrics facilitate comparisons between segments, enabling us to evaluate performance, track trends, and measure success. As the dual protagonists of analysis, dimensions and metrics choreograph a dance that transforms data into knowledge.
Hierarchical Relationship: Where Dimensions Shape Metric Context
A hierarchical relationship emerges between dimensions and metrics, with dimensions often taking the role of the foundation upon which metrics stand. Dimensions provide the crucial context that breathes life into metrics, bestowing them with meaning and relevance. Consider a sales report that presents revenue figures. Without the dimension of time, these metrics would be mere numbers lacking context. Time, as a dimension, provides the canvas for metrics to tell a story—unveiling sales spikes, seasonal trends, and growth trajectories. In this symbiotic partnership, dimensions lay the groundwork for metrics to shine, ensuring that the data’s narrative remains coherent and interpretable.
Difference Table: Dimensions vs. Metrics
How can you effectively pair dimensions and metrics for a successful digital campaign analysis?
Digital campaigns are an integral part of modern marketing strategies, leveraging the power of data to drive engagement, conversions, and brand awareness. However, harnessing the potential of these campaigns requires a keen understanding of how dimensions and metrics come together to reveal actionable insights. Here are some practical tips to ensure an effective dimension-metric pairing for a successful digital campaign analysis:
Avoiding Data Overload: Streamlining for Clarity
In the realm of digital campaigns, it’s easy to succumb to the allure of abundant data. Yet, drowning in an ocean of dimensions and metrics can hinder rather than enhance analysis. To prevent data overload, focus on selecting a focused set of dimensions and metrics that align directly with your campaign objectives. For instance, if you’re analyzing the impact of social media ads, choose dimensions like ad format, audience demographics, and campaign duration. Similarly, opt for metrics such as click-through rate (CTR), conversion rate, and return on ad spend (ROAS). By limiting your selection to those most relevant, you’ll create a clear and concise narrative that drives actionable insights.
Contextual Interpretation: Averting Misinterpretation Pitfalls
Metrics in a digital campaign context can be deceptive without their context-rich companions: dimensions. Imagine analyzing a campaign’s click-through rate without considering the dimension of ad placement. Click-through rates might vary significantly depending on whether the ad was displayed on a search engine results page, a social media feed, or a partner website. By interpreting metrics within their associated dimensions, you gain a nuanced understanding of performance. This contextual interpretation helps you avoid misinterpretation pitfalls and enables you to make informed decisions based on the complete picture.
Visual Representation: The Power of Data Visualization
In the dynamic landscape of digital campaigns, data visualization emerges as a potent tool for conveying complex relationships between dimensions and metrics. Utilize charts, graphs, and visual aids to encapsulate insights in a concise and engaging manner. For instance, a line chart could illustrate how changes in ad spend (metric) over time (dimension) correlate with fluctuations in website traffic. A pie chart might showcase the distribution of clicks (metric) across different ad formats (dimension). These visualizations not only simplify comprehension but also highlight trends and patterns that might be overlooked in raw data.
Conclusion
In the intricate world of digital campaign analysis, dimensions and metrics harmonize to compose a symphony of insights. By carefully selecting relevant dimensions and metrics, interpreting metrics within context, and leveraging the power of visual representation, marketers and analysts can unlock a treasure trove of actionable information. Just as a conductor expertly orchestrates an ensemble, mastering the dimension-metric pairing enables you to create a masterpiece of data-driven decision-making, propelling your digital campaigns to new heights of success. Remember, it’s not merely about the quantity of data, but the quality of insight derived from the strategic interplay of dimensions and metrics.
FAQ
- What exactly are dimensions and metrics in data analysis?
Dimensions are qualitative attributes that provide context and describe characteristics, while metrics are quantitative measurements used to quantify and evaluate data. - How do dimensions and metrics work together in analysis?
Dimensions organize and segment data, offering different viewpoints, while metrics perform calculations and comparisons, providing actionable insights based on those viewpoints. - Why is it important to interpret metrics within the context of their associated dimensions?Interpreting metrics within context ensures a complete and accurate understanding of data. Dimensions provide the backdrop for meaningful interpretation and help avoid misinterpretation.
- How can I avoid overwhelming my analysis with too many dimensions and metrics?
Focus on selecting a relevant set of dimensions and metrics aligned with your analysis goals. Prioritize those that directly contribute to answering your key questions. - What role do visualizations play in presenting dimensions and metrics?
Visualizations, such as charts and graphs, visually represent the relationships between dimensions and metrics. They simplify complex data, making insights more accessible and actionable. - Can you provide an example of how dimensions and metrics are applied in a real-world scenario?
Sure! Imagine analyzing a website’s traffic data. “Time” could be a dimension, allowing you to segment data by days or months. Metrics like “Page Views” and “Bounce Rate” quantify user engagement, and the visual representation of this data helps identify trends and optimize website performance.